Create a new Structure Drawing and Apply Per-Nucleotide Color Formatting
In this tutorial, you'll create a new structure in the StructureEditor program, starting with just a sequence and an (optional) list of basepairs. Then you will apply color formatting (aka color annotations) to nucleotides based on values frome experimental data.
Contents:
- Install and Run the StructureEditor program
- Download example files
- Briefly Review Documentation
- Create a new file.
- Edit the Secondary Structure (Add/Remove Basepairs)
- Redraw and Edit Layout
- Apply Color Annotations
- Save the Drawing
-
Install and Run the StructureEditor program
- Windows: Install the RNAstructure Grapical Interface, which includes the StructureEditor (if you have not already done so). Double-click the StructureEditor Shortcut on the Desktop or launch it from the Start Menu.
- Mac OSX: Download and run the StructureEditor.dmg file. You can copy the StructureEditor App into your Applications folder or into a location of your choice. Then run the StructureEditor App.
- Linux: Install the RNAstructure Grapical Interface archive and extract it. Then run the StructureEditor bash script inside the RNAstructure/exe directory.
-
Download example files
- You can download the following files for this tutorial or you can use your own sequence and related files, or you can just make up a sequence and generate some experimental data.
- Example Sequence and Structure file: ca5s.dbn
- Example Experimental Data file: numeric-data.txt
- If you do use your own files, you will need the following:
- An RNA or DNA sequence
- Some optional structure information in one of the following formats: (A) Dot-Bracket notation, (B) Helix Notation, or (C) as a list of basepairs (e.g. X:Y)
- Some experimental or other numeric data that associates a numeric value with each nucleotide.
-
Briefly Review Documentation
This tutorial only demonstrates a few features of the StructureEditor. For more detailed information, click or press F1 to view additional documentation about program features and usage.
-
Create a new file.
- In the StructureEditor program, click . or press Control+N (Cmd+N on Mac).
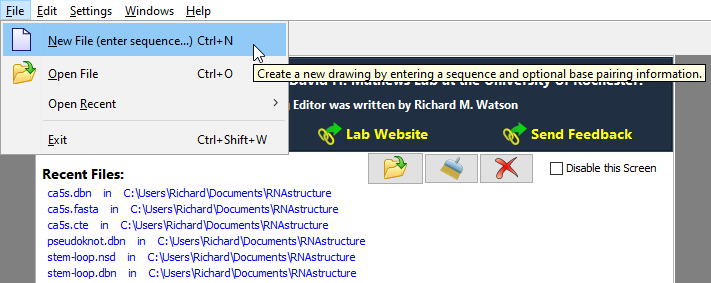
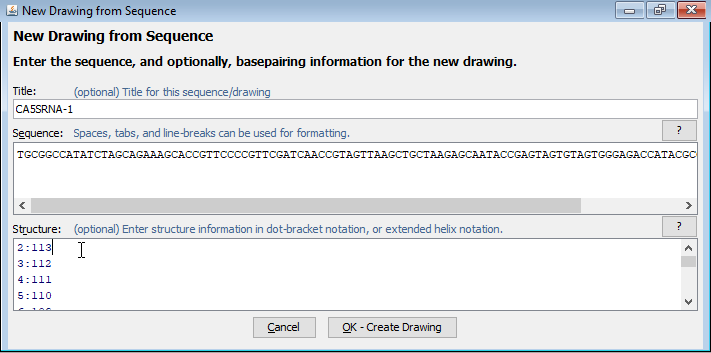
- Enter a name for the sequence in the "Title" box and type or paste the sequence into the "Sequence" box. It is recommended that you use uppercase letters (A, G, C, and U or T) because RNAstructure programs typically use the convention that lowercase letters (a, g, c, and u or t) indicate a nucleobase that cannot form basepairs and is forced single-stranded in structure predictions.
- If you have structure infomation, you can type or paste it into the "Structure" box. This can be in one of three formats:
- Dot-Bracket Notation
- A list of basepairs in the form X:Y
- (Extended) Helix Notation
- Dot-Bracket Notation
Tip: Instead of entering the sequence and structure information manually, you can use the menu item to load a sequence file (FASTA or SEQ) or a structure file (CT, or Dot-Bracket etc).
Click here to download a Dot-Bracket file that contains the same sequence and structure used in this tutorial. - In the StructureEditor program, click . or press Control+N (Cmd+N on Mac).
-
Edit the Secondary Structure (Add/Remove Basepairs)
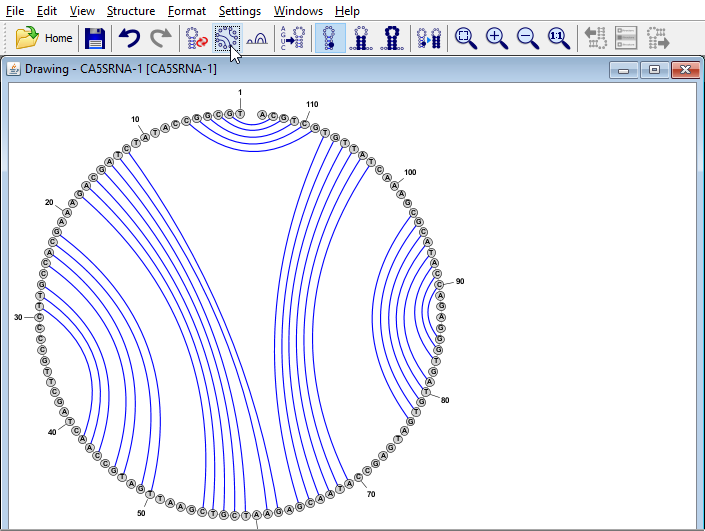
- If you loaded a sequence with no structure information, you will see the sequence drawn in "circular" form. If you included structural information, the program will attempt to draw the structure in standard "radial" layout.
-
Choose from the menu (or click the corresponding toolbar icon, as shown in the figure). This will switch the editor into Circular Mode which can be useful to view and edit secondary structure.
- You can add new basepairs by holding down the Control key while clicking with the mouse on one nucleobase, then holding the mouse button down while dragging the pointer to a second nucleobase. When you release the mouse button over the second nucleobase, the program will create a new basepair between the two nucleobases.
- To delete a basepair, you can simply click on a paired nucleobase press the Delete key.
You can delete multiple basepairs at once by selecting several nucleobases and then pressing the Delete key.
(Delete does NOT remove the base itself -- just any basepairs connected to it.)
Tip: You can select multiple bases by clicking on empty space in the editor window and dragging the mouse to create a selection rectangle. Alternatively you can click on a base and then SHIFT+Click on any number of additional bases to include them in the selection.
Tip: You do not need to switch to Circular Mode in order to add or remove basepairs. This can be done the same way in any drawing mode (Circular, Radial, or Linear). Sometimes pairs are easier to add in Circular Mode, but often Radial mode is just as effective, if not more so.
-
Redraw and Edit Layout
- Click from the menu (or click the corresponding toolbar icon, as shown in the figure). This will switch the editor into Radial Mode which shows secondary structure motifs such as helices and loops. You can continue to add or remove basepairs in this mode, but the visual layout of the structure will not change unless you again click to redraw the full structure.
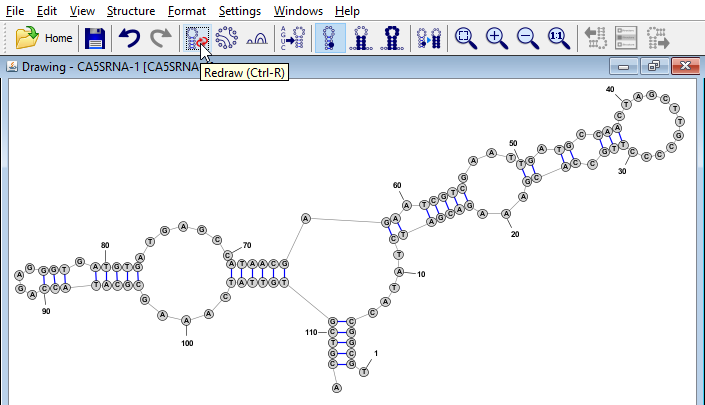
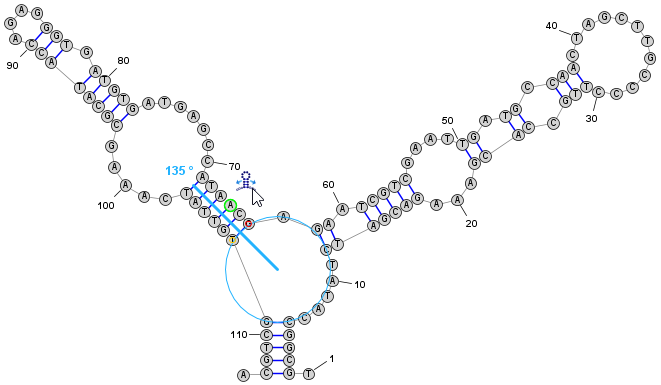
- In Radial Mode you can also change the visual layout of the structure by clicking and dragging individual nucleobases or by using special "Drag Handle" icons that allow you to easily rearrange helices, multi-branch loops, and hairpins, etc. These are described in the StructureEditor's help documentation.
- Click from the menu (or click the corresponding toolbar icon, as shown in the figure). This will switch the editor into Radial Mode which shows secondary structure motifs such as helices and loops. You can continue to add or remove basepairs in this mode, but the visual layout of the structure will not change unless you again click to redraw the full structure.
-
Apply Color Annotations
- Click the menu item or press Control+F to open the Color Annotations window.
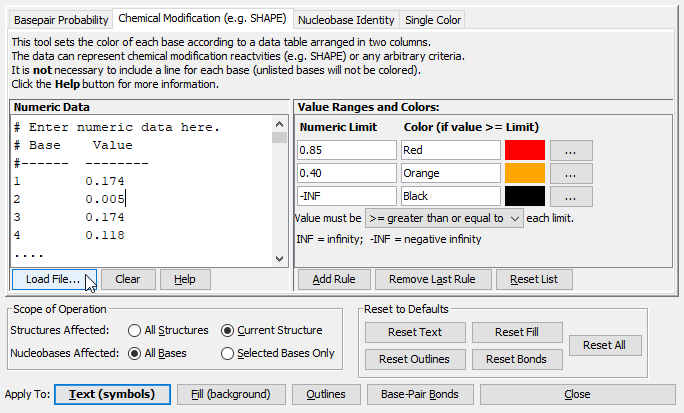
- Click on the Chemical Modification tab. This tab allows you to enter data in a format that associates one decimal number with each nucleotide in the sequence and then apply a color to each nucleotide based on its numeric value. Often this type of data comes from experimental sources such as SHAPE, but it could potentially be any type of per-nucleotide numeric data.
- The format of the data must as follows:
- Each line should contain two numbers: the nucleotide index followed by the numeric value associated with it. (The index of the first nucleotide is 1, not 0).
- The two numbers must be separated by at least one space or tab character. (Any additional spaces or tabs at the beginning or end of the line are ignored).
- The nucleotides may be listed in any order.
- It is not necessary to list a value for every nucleotide. (Unlisted nucleotides will be unaffected by color annotation.)
- Blank lines are ignored and lines that start with certain symbols ( # / ; ! ) are considered comments and are also ignored.
- Paste your data into the "Numeric Data" textbox or click "Load File" to read in an existing text file. Click here to download a file containing the example numeric data used in this tutorial.
- Edit the list of "Value Ranges and Colors" to add as many color ranges as desired. Click the "Add Rule" button to add additional color ranges. In this tutorial we will add two more for a total of five, but you are free to add as many as are appropriate for your circumstances.
- You can click on the color-boxes to choose different colors, or you can type in a color name (like "Red", "Blue" etc) or a hexadecimal color value (#RRGGBB).
- Enter the lower limit of each color range. In this tutorial, we have chosen five value ranges: 0 to 1 (White), 1 to 2 (light yellow), 2 to 5 (light green), 5 to 10 (aqua) and above 10 (blue). See figure below.
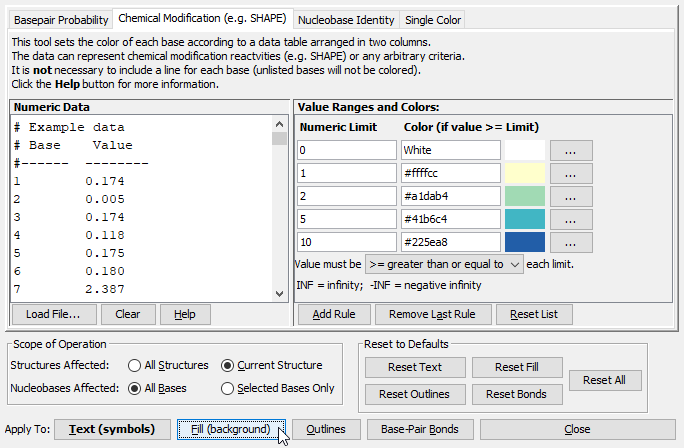
- Color annotations can affect all bases in the sequence or just currently-selected bases. Click All Bases (next to the label "Nucleobases Affected" -- see figure above). This way, colors will affect all bases, regardless of the current selection.
- Nucleobases have several visual properties that can be colored -- the Text (i.e. the nucleobase letter), the Fill color (background), the circular Outline, or the line drawn between paired bases (aka the "base-pair bond").
- Click the Fill (background) button to apply the chosen colors to the structure (based on the values associated with each nucleotide in the numeric data).
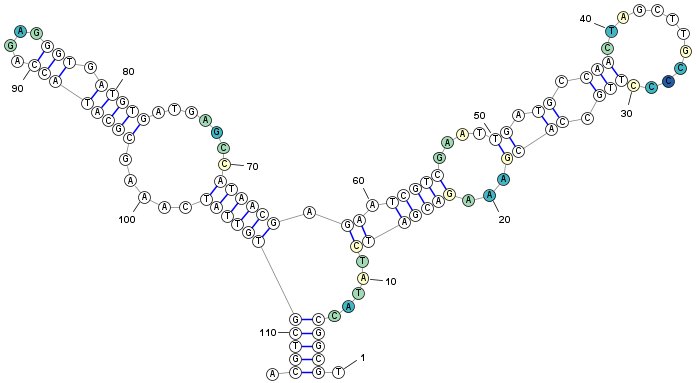
- If you have used the strucuture, data, and color ranges in this tutorial, your structure should look similar to the following figure.
-
Save the Drawing
- Click the menu item or press Control+S to save the drawing as a "Nucleic Acid Structure Drawing" (NSD) file. This file format stores sequence and structure information as well as layout (positioning) and color information.
- You can also Export the drawing to other file types and formats by clicking the menu item or pressing Control+Shift+E. For example, you can export image files (PNG, JPEG, SVG) as well as other file types used by RNAstructure (and other RNA analysis software) such as CT, Dot-Bracket, and FASTA or SEQ files.